Over a decade ago, when I began my trading journey, I thought it would be a walk in the park. I would watch seasoned retail traders stream their mornings and make thousands of dollars by 12 p.m. EST, all while confidently identifying patterns and timing their entries and exits. I thought I could replicate their success with ease.
Little did I know that trading would be far more difficult than anticipated. I would often buy right before the price dropped and hit my stop loss—something that happened so frequently it left me frustrated and pulling my hair out. I still hit my stop loss from time to time (as is par for the course in trading), but now it happens far less frequently—and I know exactly why.
Understanding chart patterns and mastering your emotions are essential to becoming a consistent and profitable trader. I want to share and spread the knowledge of these subtle yet powerful intricacies that are often overlooked, but that can significantly improve the outcomes for any retail trader. Join me on this educational journey as we explore one of the most powerful and frequent chart patterns for intra-day trading: the flag and pennant patterns.
Understanding the Basics
Before we can start we need to go over some of the basics in reading and understanding charts. If you already have an understanding of the basics feel free to skip this section. Charts can come in many different forms and the most common and potentially most useful in trading is the candlestick chart which displays 4 points for every unified time frame indicated by the x axis. The 4 points are a summation of everything transaction that occurred within the time frame and shows the high, low, open and close. Another way to say this is that its taking the maximum, minimum, first, and last transactions. The second thing we basic thing we need to understand is support and resistance levels which are areas where there is a small or micro reversal to a larger trend, clustered around a static price.

Flags and Pennants: The Foundation
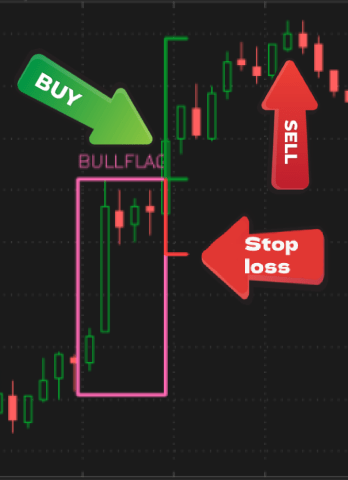
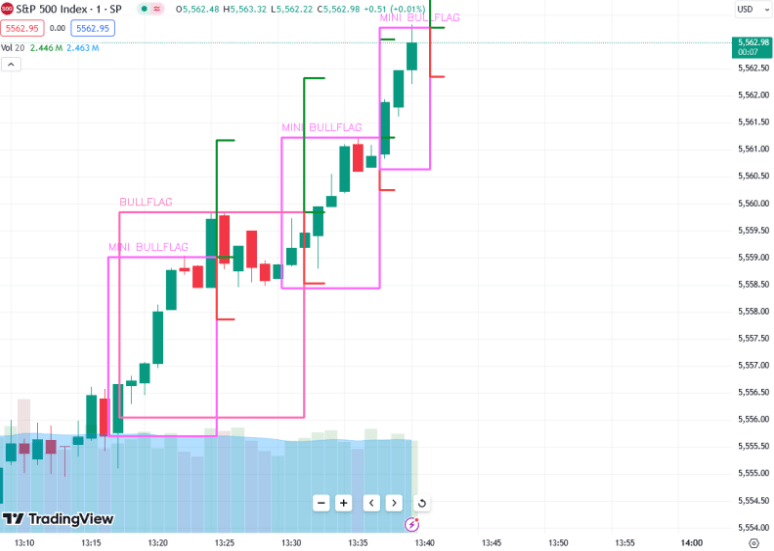
Often referred to as bull or bear flags, these are continuation patterns (learn more about continuation and reversal patterns), which suggest the price will keep moving in the direction of the prevailing trend. In a bullish trend, the price breaks out and runs upward for 1–3 candles, forming the “flagpole.” This is followed by a brief consolidation that resembles a small rectangle (flag) or triangle (pennant).
It’s common for the price to drop slightly during the consolidation phase—but for the pattern to remain valid, this pullback should not exceed 50% of the flagpole’s length. A deeper retracement invalidates the pattern and signals that it’s better to wait for a clearer setup.
Strategy and Game Plan
With the pattern formed, it’s time to plan entries, exits, and risk controls.
The ideal entry occurs when a candle breaks and closes above the consolidation zone and the flagpole’s high. The next candle is your buy trigger. A common mistake I made early on was entering during the consolidation, assuming the breakout was inevitable. That mistake often led to losses.
Statistically, even when a flag is correctly identified, there’s only about a 60% chance the price will continue in the desired direction. That’s why confirmation and waiting for a close above the flagpole are key to increasing the odds of success.
Once confirmed, the expectation is that the price will move an equal distance to the length of the flagpole, starting from the breakout point.

Setting Exit Points and Stop Losses
Once the entry point has been established our next step is to establish a good exit point as well as a stop loss. Typically only one will be used with the expectation that the good exit point will be the one used however things may not always work out in our favor so to manage our risk properly we should always have a stop loss when entering a trade. When trading a flag or pennant pattern a safe and typical stop loss is at the bottom point of the flag or pennant. Our good exit will the 80% the length of the flag pole starting from the top of the flag pole. Obviously the price can always go higher than that point however it is also important to trade the pattern, stay consistent, and manage risk to shore up some profits. Flags and pennants are incredibly common especially when looking at any intra-day time frame so there are always more opportunities right around the corner. If you have a higher risk tolerance you could always sell a portion of your holdings and move your stop loss up to break even to ensure some profit.
Conclusion
To summarize and wrap up, flag and pennant patterns are one of the most common and powerful chart patterns for intra-day trading and shows up frequently on most stocks. You can identify a flag or pennant chart pattern when there is a large and sudden spike in price lasting around 1-3 candles which is then followed by a consolidation or slight pullback period. Our entry will be just above the spiked candles known and the flag pole. We will measure the length of the flag pole to find our good exit and we will place our stop loss at the bottom of the flag or pennant for proper risk management. Once the pattern has fully played out we will wait for the next pattern to occur and repeat the process.

I hope this learning this pattern helps you in your trading journey and find success in using it. If you have trouble spotting the flag and pennant patterns I have built a tool that will identify and out line this in real-time that you can use yourself. You can visit visualizetrades.com to sign up and download it for yourself to try it out. Always start with simulated trading or paper trading when you are just starting out for practice and avoid any unnecessary losses. Stay safe and have fun out there.
Pingback: Step-by-Step Process for Building a Profitable Trading Strategy - VisualizeTrades