Introduction to Continuation and Reversal Patterns
Technical analysis in trading relies heavily on identifying patterns that can predict future price movements. Among the most significant patterns are continuation and reversal patterns. Continuation patterns suggest that the current trend will persist, while reversal patterns indicate that the trend is about to change direction.
Understanding these patterns is crucial for traders who want to make informed decisions. By recognizing these formations on price charts, traders can enter and exit positions more effectively, maximizing their potential for profit and minimizing risks. This article delves into the specifics of continuation and reversal patterns and provides strategies for trading them successfully.
Understanding Continuation Patterns
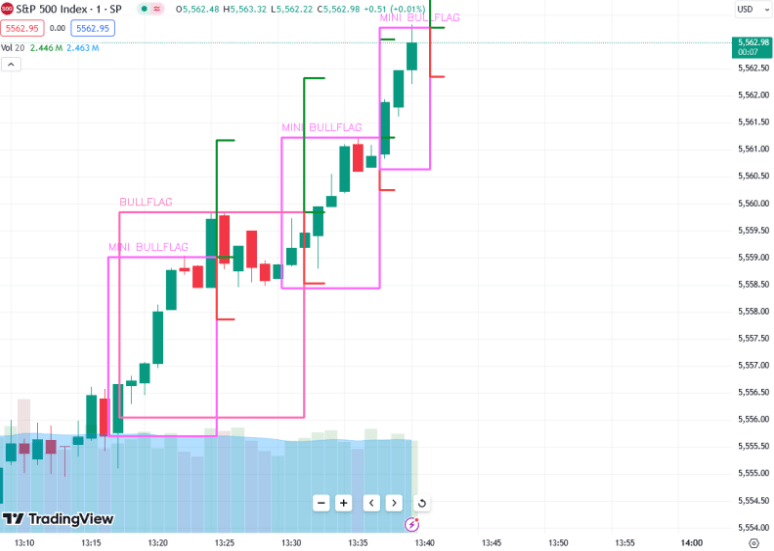
Continuation patterns occur during a pause in the prevailing trend and signal that the trend will likely resume after the pattern completes. These patterns reflect a period of consolidation where the market takes a breather before continuing in the same direction.
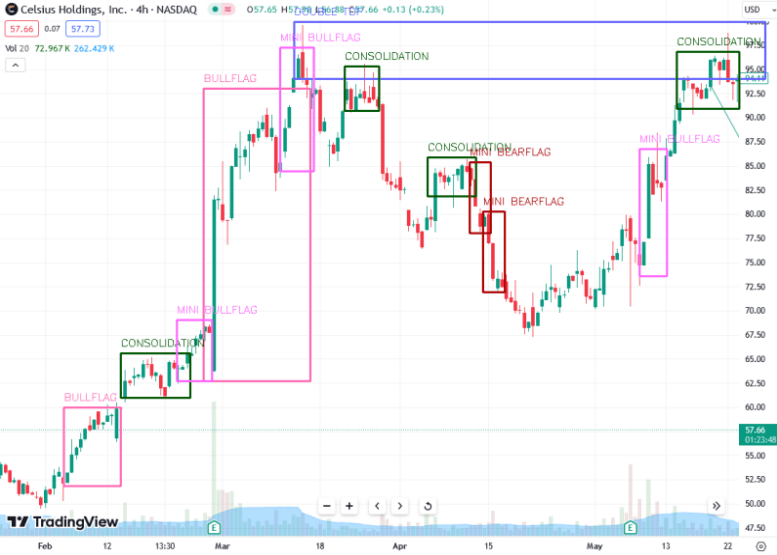
Common continuation patterns include flags, pennants, and triangles. For example, a flag pattern consists of a sharp price movement followed by a rectangular consolidation area. Recognizing these patterns helps traders to predict when the market will break out and continue its previous trend, allowing them to enter trades at optimal points.

Identifying Reversal Patterns
Reversal patterns indicate that the current trend is likely to change direction. These patterns form at the end of a trend and suggest a potential shift from an uptrend to a downtrend, or vice versa. Identifying these patterns can help traders exit positions before the market reverses, protecting their profits.
Common reversal patterns include head and shoulders, double tops and bottoms, and inverse head and shoulders. For instance, a head and shoulders pattern consists of three peaks, with the middle peak being the highest. Recognizing these patterns allows traders to anticipate trend reversals and position themselves accordingly.

Key Characteristics of Continuation Patterns
Continuation patterns share several key characteristics that traders can look for. They typically occur in the middle of a trend and represent a consolidation phase where the price moves sideways or slightly against the prevailing trend. Volume often decreases during the formation of these patterns, indicating a temporary lull in market activity.
The breakout from a continuation pattern is usually accompanied by a significant increase in volume, signaling the resumption of the trend. Traders should watch for these volume cues as confirmation that the pattern is valid and the trend is continuing. Understanding these characteristics helps traders to differentiate continuation patterns from other market movements.
Common Reversal Patterns to Watch For
Several reversal patterns are essential for traders to recognize. The head and shoulders pattern is one of the most reliable indicators of a trend reversal. It consists of three peaks, with the middle peak (the head) being higher than the two outer peaks (the shoulders). When the price breaks below the neckline, a reversal is likely.
Double tops and bottoms are another common reversal pattern. A double top forms after an uptrend, when the price reaches a high point twice but fails to break through, indicating a potential downward reversal. Conversely, a double bottom forms after a downtrend, when the price reaches a low point twice but fails to fall further, indicating an upward reversal. These patterns help traders anticipate market changes and adjust their strategies accordingly.
Steps to Trade Continuation Patterns
Trading continuation patterns involves several steps to ensure a strategic approach. First, identify the prevailing trend and look for potential continuation patterns forming during periods of consolidation. Use technical indicators such as trendlines and moving averages to confirm the pattern.
Once the continuation pattern is identified, wait for a breakout above the upper trendline of the pattern, accompanied by an increase in volume. Enter a trade in the direction of the prevailing trend, setting a stop-loss order below the lower trendline to manage risk. Monitor the trade and consider taking profits as the price moves in the anticipated direction, based on the height of the initial trend move leading into the pattern.
Strategies for Trading Reversal Patterns
Trading reversal patterns requires a keen understanding of market dynamics and risk management. Begin by identifying the existing trend and looking for signs of potential reversal patterns forming at the trend’s peak or trough. Use additional indicators such as the Relative Strength Index (RSI) and Moving Average Convergence Divergence (MACD) to confirm overbought or oversold conditions.
Once a reversal pattern is confirmed, enter a trade in the direction opposite to the prevailing trend. Set a stop-loss order above the upper boundary of the reversal pattern for bearish reversals or below the lower boundary for bullish reversals. This approach minimizes potential losses if the reversal fails. Exit the trade based on predefined profit targets or trailing stop orders to capture gains as the new trend develops.
Using Technical Indicators with Continuation and Reversal Patterns
Technical indicators play a crucial role in validating continuation and reversal patterns. Moving averages can help identify the prevailing trend and potential support or resistance levels within the pattern. For example, the 50-day and 200-day moving averages are commonly used to confirm trend direction.
Volume analysis is another critical tool. An increase in volume during a breakout from a continuation pattern or a breakdown from a reversal pattern signals strong market interest and enhances the likelihood of a successful trade. Oscillators like the RSI and MACD can provide additional confirmation by indicating overbought or oversold conditions, helping traders to time their entries and exits more effectively.
Real-Life Examples of Continuation and Reversal Trades
Real-life examples of continuation and reversal trades can offer valuable insights into how these patterns work in practice. Consider a stock in a strong uptrend that forms a flag pattern. After the consolidation phase, the stock breaks out above the upper trendline on increased volume. A trader who identifies this pattern and enters a long position can ride the next leg of the uptrend, capturing significant gains.
Conversely, a reversal pattern such as a head and shoulders can signal the end of an uptrend. If a stock forms a head and shoulders pattern and breaks below the neckline, a trader can enter a short position, anticipating a downward reversal. By studying these real-life examples, traders can better understand how to apply pattern recognition and trading strategies to actual market scenarios.
Conclusion: Mastering Continuation and Reversal Pattern Trading
Mastering continuation and reversal pattern trading requires a blend of technical analysis skills, market knowledge, and disciplined trading practices. By understanding the key characteristics and common formations of these patterns, traders can identify high-probability trading opportunities and make informed decisions.
Consistent practice and analysis of historical trades can enhance a trader’s ability to spot and trade these patterns effectively. Incorporating technical indicators and developing robust risk management strategies further refine the approach, leading to better trading outcomes. With dedication and continuous learning, traders can master the art of trading continuation and reversal patterns, ultimately achieving greater success in the financial markets.
Pingback: A Guide to Trading the Most Powerful Chart Pattern: The Flag and Pennant - VisualizeTrades