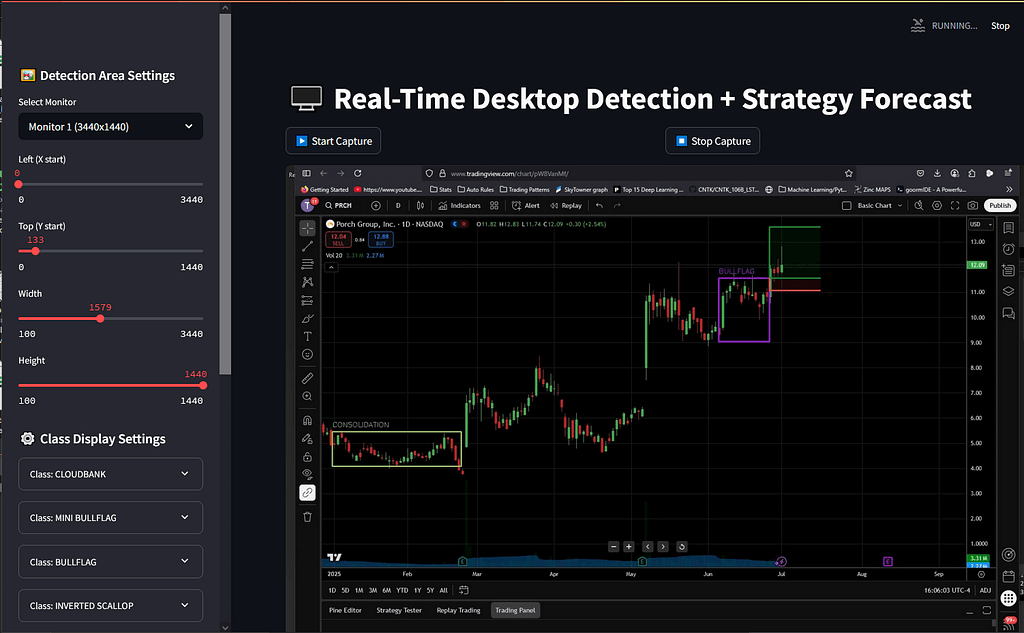
If you’ve ever wondered how professional traders consistently spot winning stocks before they break out, the answer often lies in a blend of momentum and technical structure. In this guide, we’ll walk through a powerful strategy that combines 52-week high momentum filtering with chart pattern recognition for precise, high-probability trades. It’s ideal for swing traders, position traders, and even active investors looking for structured, repeatable edge.
📈 What Is the 52-Week High Momentum Strategy?
Stocks making new 52-week highs are statistically more likely to continue higher. Institutions often accumulate shares as a company breaks into new territory, creating strong price momentum. But blindly buying every 52-week high is a mistake. That’s where chart patterns come in.
This strategy first filters for stocks near new highs, then waits for bullish chart patterns to confirm entry. It provides structure, risk control, and higher conviction.
🔧 Step 1: Run the Right Screener Filters
Use a screener like TradingView, Finviz, or ChartMill with the following criteria:
| Filter Name | Setting | Purpose |
|---|---|---|
| Price | >$5 or $10 | Avoid illiquid penny stocks |
| Avg. Volume (10-Day) | >500K or 1M | Ensure enough liquidity |
| Relative Volume | >1.2 | Confirm active buying |
| 52-Week High Proximity | within 1-2% of high | Near breakout Level |
| RSI (14) | 55-75 | Momentum without overbought risk |
| Market Cap (Optional) | >$500M | Institutional-grade stocks |
🔹 Step 2: Identify Chart Patterns Near Highs
Once your screener gives you potential tickers, scan for bullish continuation patterns:
- Bull Flag: Tight consolidation after a strong move
- Ascending Triangle: Resistance holds while higher lows form
- Cup and Handle: Rounded base followed by small pullback
- Flat Top Base: Tight horizontal range near highs
These patterns suggest buyers are absorbing supply and preparing to push price higher.
📍 Step 3: Define Entry and Exit Rules
🔑 Entry:
- Wait for a confirmed breakout from the pattern
- Volume must be above average
- Optional: Use MACD crossover or RSI surge as confirmation
⛔ Stop Loss:
- Set below the low of the pattern
- Don’t widen the stop based on hope
📈 Profit Target:
- Use measured move (e.g., height of bull flag projected upward)
- Or use 2:1 or 3:1 Risk/Reward ratio
- Consider trailing stops if momentum is strong
🔢 Real-World Example
Stock XYZ is consolidating in a bull flag just under its 52-week high.
- Price: $12
- 52-week high: $12.10
- Breakout candle closes at $12.10 with volume spike
- Entry: $12.20
- Stop: $11.40 (below flag low)
- Target: $14 (measured move)

This setup offers clear structure, risk control, and a high-probability edge. If volume stays and continuation patterns emerge before and after the target, stop loss can be moved up to breakeven or the entry and target can be moved up with a measured move.
The software I am using here is TradingView’s screener and chart along with Visualize Trade’s pattern recognition software. The screener is used to find the stocks that meet the criteria in step one, the chart and Visualize Trades software are used to find the right places to enter and exit while managing risk.
🧠 Why This Strategy Works
There are a couple of reasons why this strategy works well. Hitting new highs in any time frame is one of the most common filters for trades. The 52 week high triggers a momentum bias and increases the number of traders watching the stock which can lead to an increase in volume. Waiting for a technical structure like a bull flag or pennant reduces the risk of false breakouts which follows a good risk management strategy.
✅ Final Checklist
Before you enter a trade using this strategy, ask yourself:
- ☑ Is the stock within 2% of its 52-week high?
- ☑ Is there a valid chart pattern with clean structure?
- ☑ Did volume spike on breakout?
- ☑ Are stop loss and targets clearly defined?
🎉 Bonus Tip: Use Visual Tools
Pattern detection tools like Visualize Trades can scan and alert you in real time when a pattern is forming on a high-momentum ticker. This cuts down screen time and increases consistency.
🚀 Ready to Try It?
Start by scanning your watchlist or using a screener. Look for strong names approaching highs, apply this framework, and journal each trade. Over time, you’ll develop instinct, discipline, and a data-backed edge that separates profitable traders from the rest.